TimePicker 2017
Author
Luděk Vecsey (vecsey@ig.cas.cz)
Short description
TimePicker 2017 is a Python/ObsPy software package for a fully automated measuring teleseismic P-wave arrival times. The multi-station method is based on t waveform cross-correlation and beam-forming approaches. The highly-accurate determination of the absolute travel time arrivals is complemented by error estimates, estimated by combining information from signal-to-noise ratios of P waveforms and levels of waveform coherence. For the first time, the TimePicker 2017 was implemented on data of more than 2000 teleseismic events recorded by stations included in the AlpArray-EASI project in 2014-2015.
Procedure steps
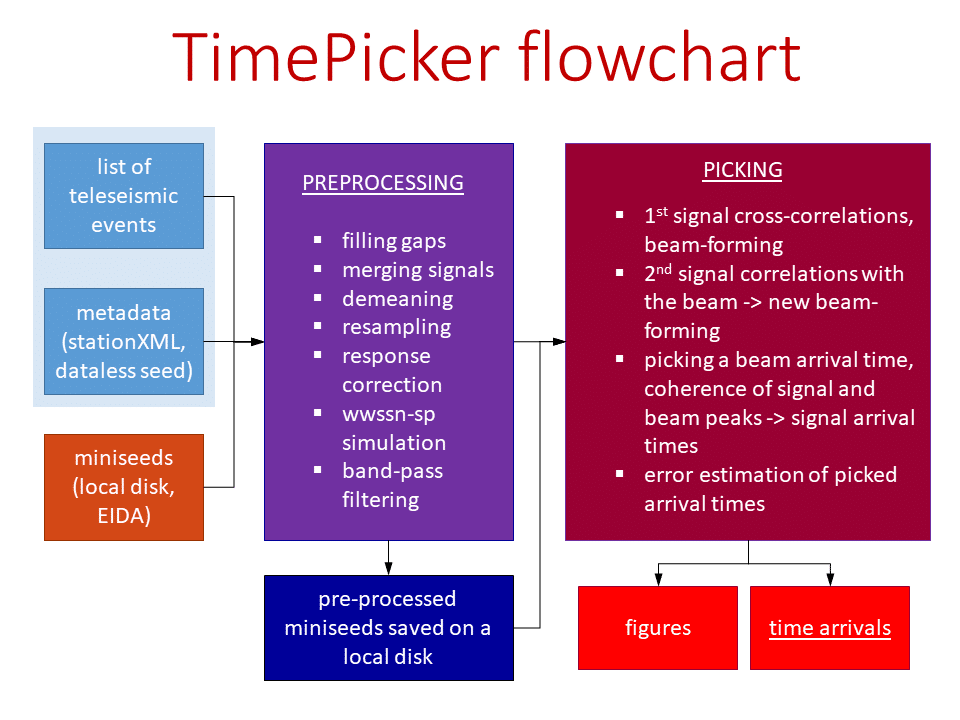
Step 1: Signal pre-processing
There are two initial inputs for the picker, a list of teleseismic events and station metadata. The picker loads mseed files either from a local disc or an EIDA node for all stations and each event, preprocesses the files and save them on a local disc. Alternatively, the picker can load already preprocessed mseed files, if available. The preprocessing includes, merging signals, demeaning, resampling, correction for instrument response, simulation of WWSN-SP instrument, and an arbitrary bandpass filtering (e.g., 0.2 – 5 s). This step includes also potential corrections of recorded signals, e.g., filling (small) gaps, if needed.
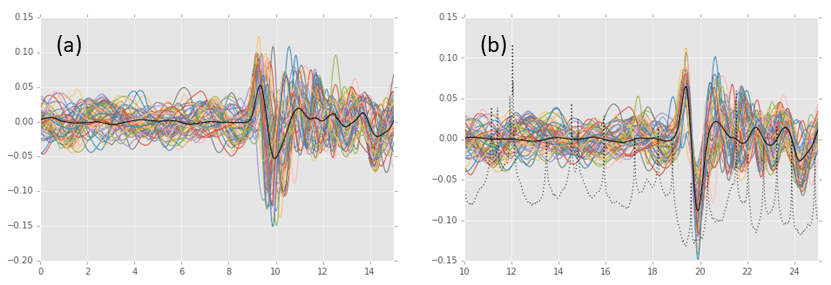
Step 2: 1st cross-correlations of all signal pairs
Only stations with sufficiently strong signal and not far from their theoretical arrival times are considered in this step (Fig. 1a). All signal pairs are aligned according to the cross-correlations. Summation of the aligned signals forms the first version of beam1 (Fig. 1b).
Step 3: 2nd cross-correlations (between the beam and signals)
Each individual signal is cross-correlated with the beam1. Shifted outliers can be included in this step. A stack of the newly aligned signals create beam2 with high signal-to-noise ratio (SNR).
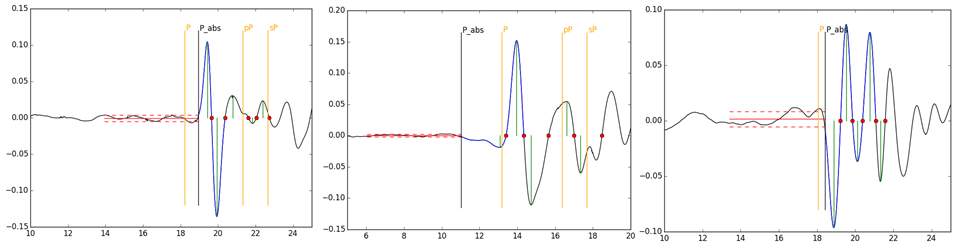
Step 4: measuring arrival time of the beam2
The arrival time on the beam2 (P_abs) is measured at a point where it leaves its noise channel located before the P waveform (Fig. 2).
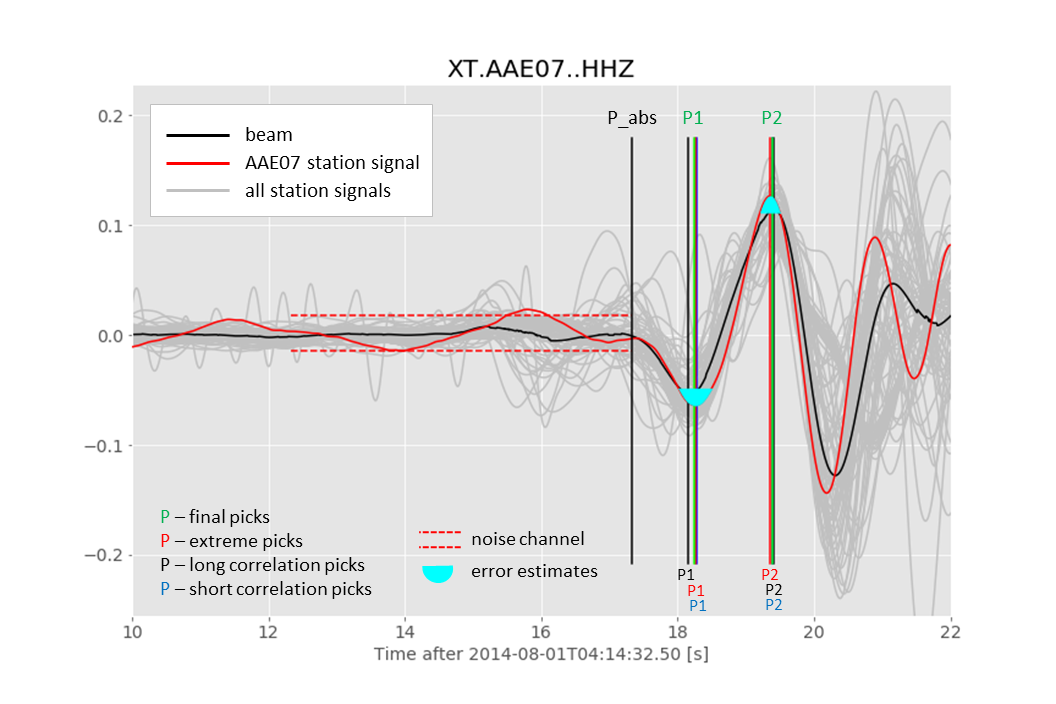
Step 5: measuring P-wav e arrival times on individual traces
The time of the signal peak is derived from combination of three measurements. First, times of the station signal extremes are picked (red P1, P2 in Fig. 3). Second, we cross-correlate the station signal with the long portion (~2.5 signal period) of the P-waveform beam2 and determine the long correlation picks (black P1, P2 in Fig. 3). Third, we cross-correlate the station signal with the short portion (~0.5 signal period) of the P-waveform beam around each of the extremes and determine the short correlation picks (blue P1, P2 in Fig. 3). The final times of the extremes (green P1, P2 in Fig. 3) are probabilistic combinations of the three partial picks (red, black and blue P1, P2), which assures coherent measurements in case of more complex waveforms. The absolute time of the P-wave arrival on a signal trace is computed by subtracting the difference between the P_abs of the beam2 and selected extreme on the beam2 trace from the corresponding time of the extreme on the signal trace.
Step 6: estimates of the signal arrival time errors
Each of the red, black and blue picks in Step 5 is complemented by an error estimate. Time error of the red extreme depends on a signal noise level (see cyan basins, their height is given by a noise magnitude – red dashed lines in Fig. 3), errors of the black and blue correlation picks come from the signal-beam2 coherences. Error estimate of the absolute P-wave arrival time is a combination of the three errors.
Step 7: selection of the best peak
Steps 3-6 are repeated in a loop for up to 5 extremes on the beam2. An extreme with the lowest error estimation is selected for computation of the P-wave arrival time on the signal. The extreme error is assigned to the absolute P-wave arrival time.
Final output:
Final output of the picker is a table with absolute P-wave arrival times and their errors for each station and event, as well as a series of figures documenting procedure steps.
Figures